Telemetry reference
kenny's picture of a PC's health is built from telemetry: the agent runs a set of
collectors, packs their results into a JSON snapshot, and pushes it to the server. This
page is the reference for what each section reports, how it is judged, and how long it is
kept. For day-to-day dashboard use see user-guide.md; for the exact
wire shape see protocol.md.
How telemetry flows
- The agent runs its collectors and pushes one JSON snapshot to the server — by
default every 15 minutes (
KENNY_TELEMETRY_INTERVAL_SECS, default900), plus an immediate first push right after it connects, so a freshly onboarded PC appears with real data at once. The on-demandtelemetry_collecttool forces a "refresh now". - The server persists every snapshot in SQLite — the latest plus roughly 30 days of per-agent history for the health trend and heatmaps.
- A daily rollup distils the hardware-health signals (disk wear and error counters,
GPU link width, fan speed per duty band, hardware-error counts) into a compact
per-device table kept for two years (
KENNY_HW_HISTORY_RETENTION_DAYS, default 730), because wear and bearing drift unfold over months, longer than raw snapshots live. The hardware forecasts are fitted on it. See ADR-0070. - The server evaluates health rules server-side (
health_rules.py). These rules are authoritative for fleet aggregation: thresholds can change without redeploying agents. - Each section also carries an agent-set status. Where a section has a server-side rule, that rule's verdict is the section's status — the agent-set one is not folded in, so a threshold change (or an operator suppression) can relax a section and not only tighten it. The agent-set status stands alone for a section with no rule, and for a rule that defers because the payload lacks the fields it scores. An agent's overall health is the worst-of all its sections.
See ADR-0007 for the push-model and storage decision.
Status model
Every section, every agent, and the fleet header use the same four-state model:
| Symbol | Status | Meaning |
|---|---|---|
| Green circle | ok |
nothing flagged |
| Muted circle | posture |
a standing configuration fact (e.g. system drive not encrypted, a remote-access port open on purpose, updater services idle) — listed on the host page with its age and once in the weekly digest; never rolls up into a host's overall status and never pushes an alert (ADR-0058). Server-side only: an agent never sends it |
| Amber ringed circle | warn |
needs attention (e.g. disk > 80 %, aging battery) |
| Red square | crit |
acute problem (e.g. Defender real-time protection off, disk ≥ 95 %) |
| Dashed grey | unknown / offline |
no recent telemetry / agent not connected |
Statuses roll up by worst-of. Within a PC, the overall status is the worst section
status; across the fleet, the header shows the worst status of any agent. crit beats
warn beats ok; an offline agent contributes unknown rather than a false ok. The
roll-up is between sections, not between the two opinions about one section — for that,
see the rule precedence above.
Telemetry sections
The table below lists every section, what it reports, and its server-side health rule (if any). Sections without a dedicated rule defer to the agent-reported status or are purely informational; several of them still feed the Today KPIs and donut (noted in the rule column).
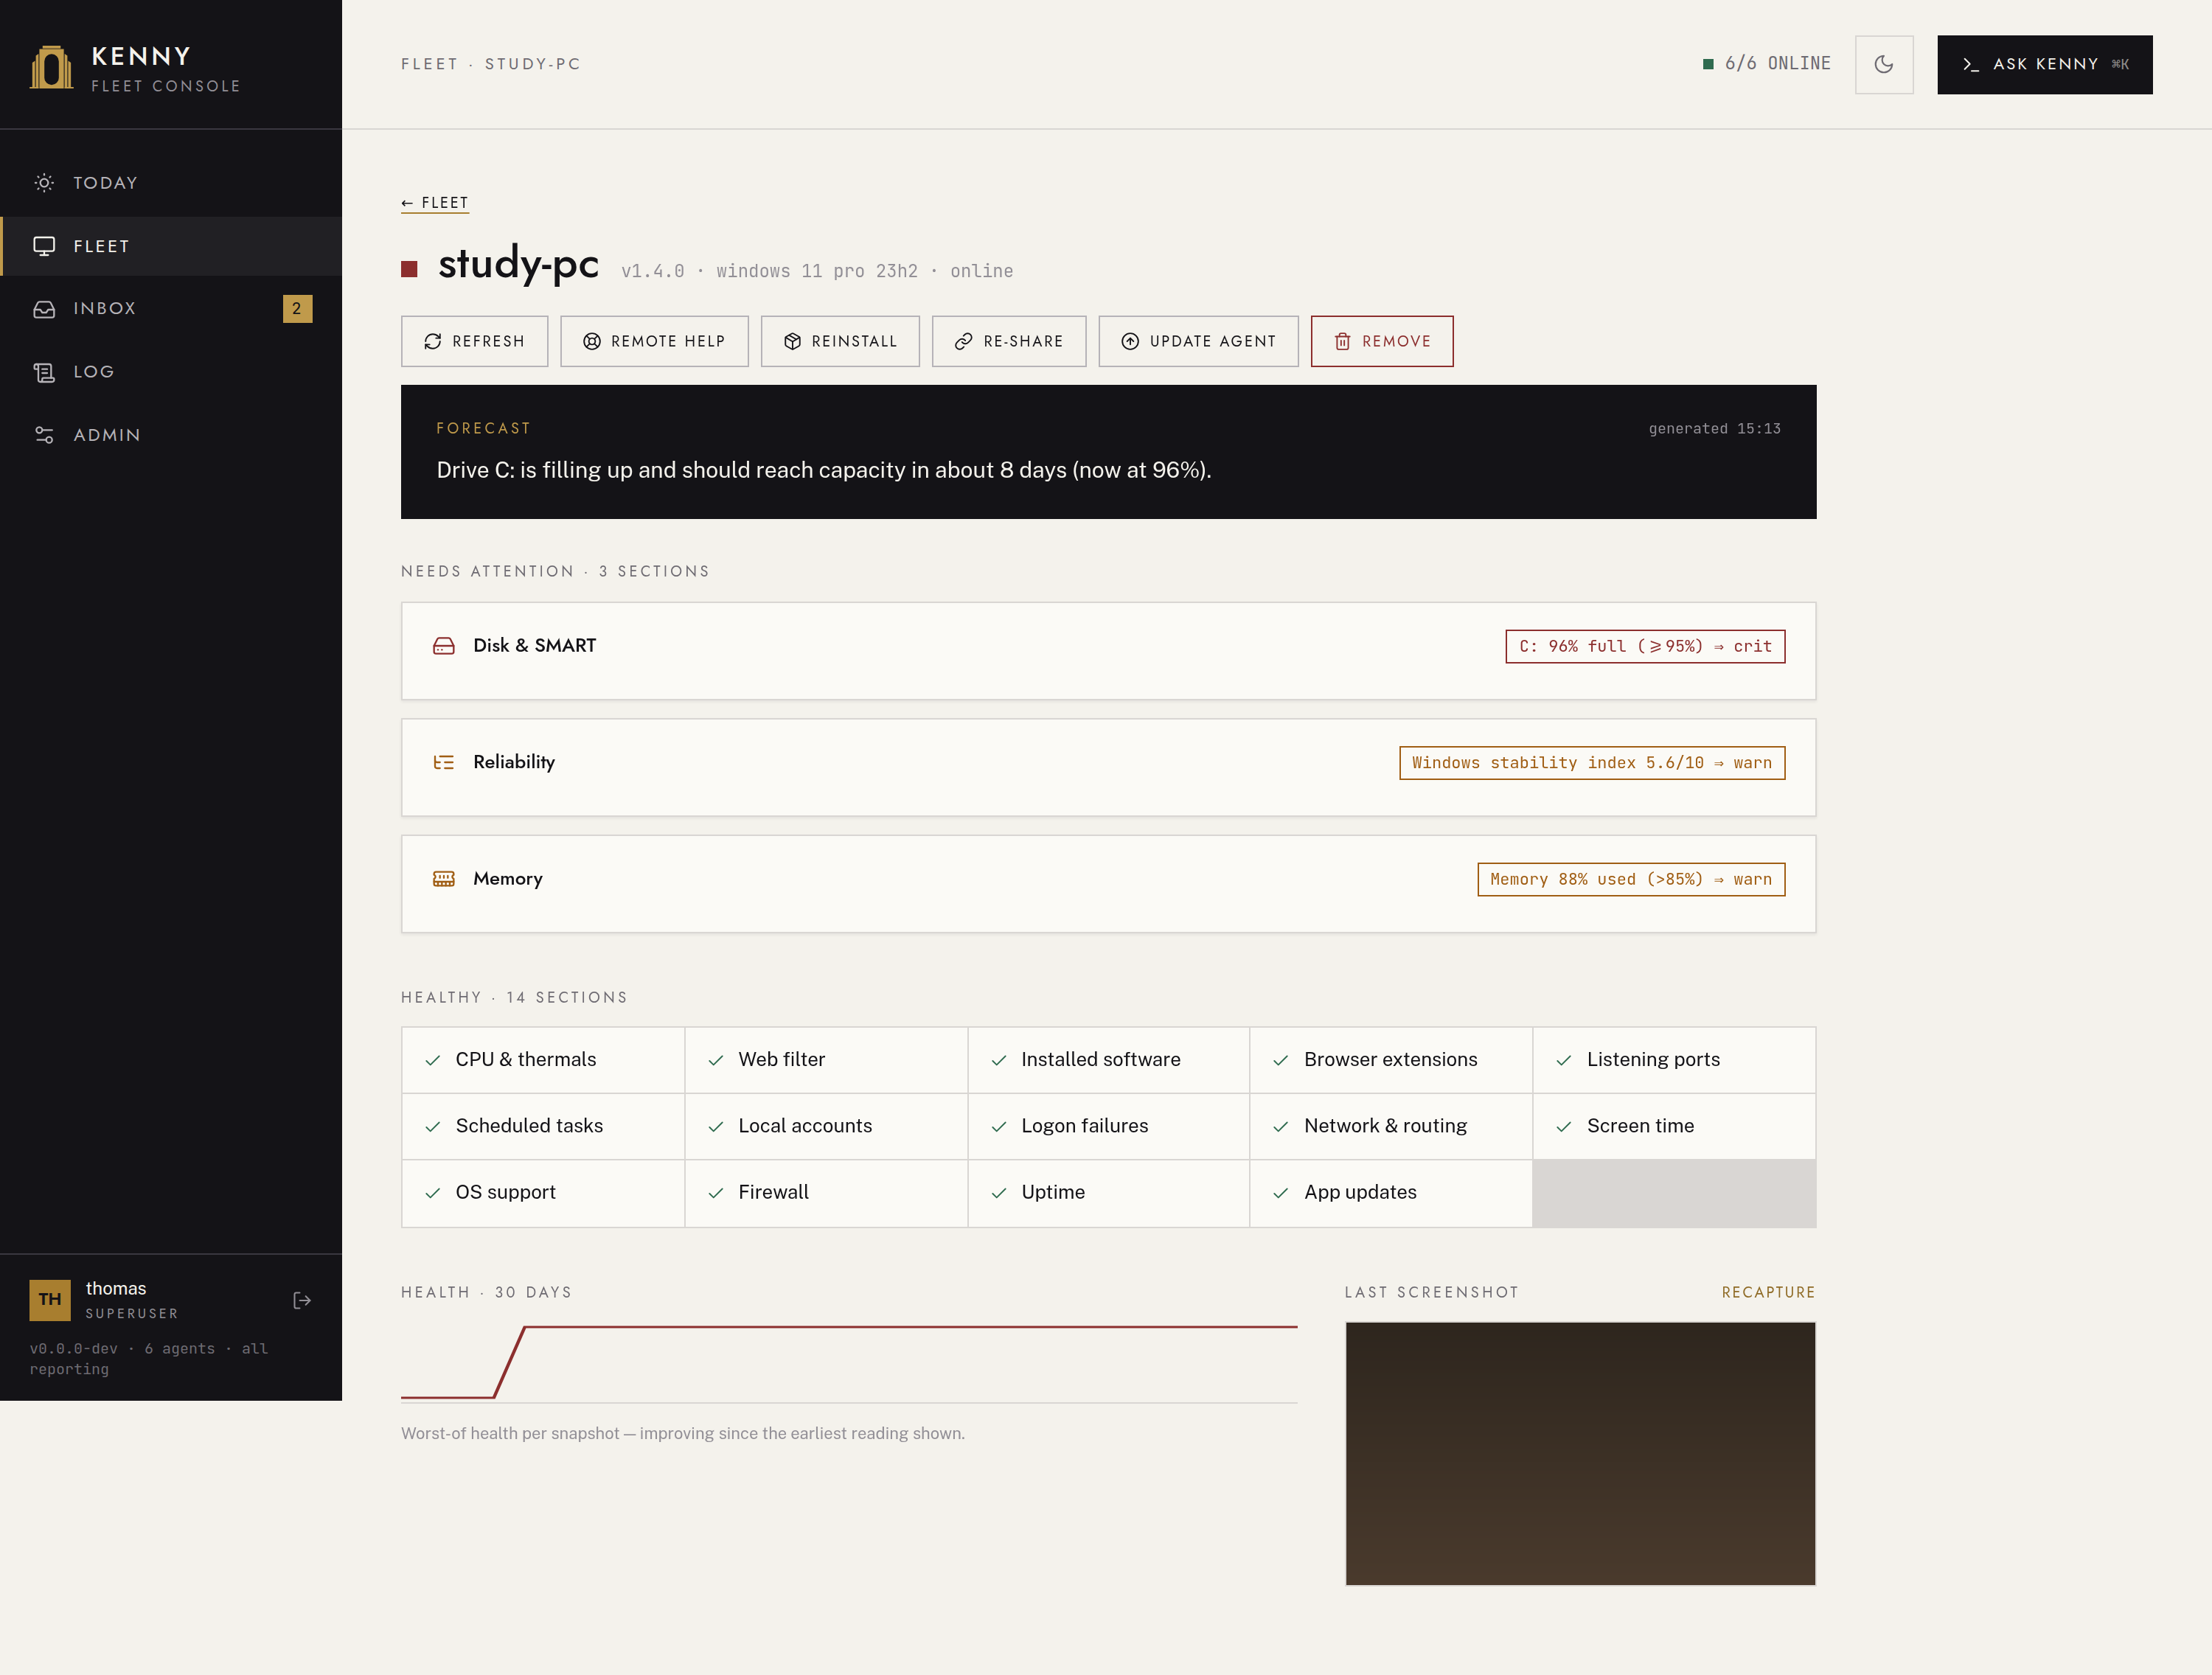
| Section | Reports | Server-side health rule |
|---|---|---|
disk |
Volumes, free space, largest directories | worst volume percent_used ≥ 95 → crit; > 80 → warn; else ok |
disk_smart |
Per physical disk: identity (model, serial, bus and media type), the OS health status and SMART failure flag, the NVMe health log (critical warning, spare capacity, endurance used, media errors, unsafe shutdowns, temperature) or the ATA SMART attribute table, uncorrected read/write counters. Windows and Linux; a paused row (anti-cheat coexistence, ADR-0035) lacks only the raw NVMe log |
Judged per internal disk (removable, USB and SD media are skipped), worst-of across disks, reported as a symptom (Disk Samsung 980 reports that it is failing). crit — predictive_failure, health_status Unhealthy, or an NVMe critical_warning bit for used-up spare capacity, degraded reliability, read-only mode or a failed power-loss backup. warn — health_status Warning, the NVMe temperature bit, or SMART 197 (pending sectors) above zero. posture — a non-zero lifetime media or uncorrected read/write counter, SMART 5 / 187 / 198 above zero on an HDD only (SSD vendors scale these differently), percentage_used ≥ 90, or an NVMe disk whose health log could not be read (an unreadable log is never healthy). An Unknown health status does not grade crit. A payload without any 0.22 field defers to the agent's own grade. Whether a counter is rising, or a wear curve is heading for 100 %, is the hardware forecast, not this rule |
defender |
Microsoft Defender state, last scan | enabled false or realtime_protection false → crit; last scan older than 14 days → warn |
defender_quarantine |
Quarantined-threat inventory | no rule — agent-reported |
av_thirdparty |
Registered third-party antivirus products | no rule — agent-reported |
firewall |
Windows Firewall profile state | no rule — feeds the security-posture chart |
encryption |
BitLocker / volume encryption state | system drive (C:, else the first volume) protection_status ≠ 1 → posture (C: not BitLocker-protected); no volumes reported → agent status stands. Windows only. Also feeds the security-posture chart |
win_update |
Recent Windows Update results | failed rows grouped by KB: a KB that failed ≥ 3 times across ≥ 2 days → crit (an update the machine cannot install); any failure → warn; last_check older than 7 days → warn. Reason names the KBs with attempts, first failure and last attempt; per-KB detail travels on details.failed. Recurrence is the signal — never the (localized) title, never the row count |
app_updates |
Available third-party app updates | no rule — agent-reported |
reboot_pending |
Pending-reboot flag and reasons | pending true → warn (reasons joined into the reason string) |
os_support |
OS edition/end-of-life date, plus arch (x86_64/aarch64, mirrors register.meta.arch, protocol 0.13), channel (stable/dev, mirrors register.meta.channel, protocol 0.17, ADR-0048) and cpu (vendor, brand, family/model/stepping and the running microcode revision, protocol 0.22) |
Worst of two checks, every finding's reason joined. OS: eol true or eol_date in the past → crit; eol_date within 90 days → warn. CPU: an affected Intel 13th/14th Gen desktop part (Raptor Lake, family 6 model 0xB7/0xBF, i5/i7/i9 of 65 W and up) running microcode older than 0x12B → warn (The CPU needs a BIOS/microcode update to prevent permanent damage). Mobile and 35 W parts, other CPUs and an unreadable microcode revision are never a finding |
memory |
RAM usage | percent_used > 95 → crit; > 85 → warn |
thermals |
Temperature sensors | hottest sensor ≥ 95 °C → crit; ≥ 85 °C → warn |
gpu |
Per graphics adapter: name, driver, utilization, temperature, power, PCIe link (current and maximum width), clock-event (throttle) reasons, and — where the driver exposes them — ECC, retired pages, row remapping and RAS counters. NVIDIA facts come from nvidia-smi, AMD RAS counters from amdgpu on Linux |
Worst across adapters; the reason names the card and what it is doing. crit — uncorrected ECC / RAS errors above zero, a row-remap failure, or failing memory pending retirement. warn — a power-brake slowdown (a power-supply or cable signal) or a hardware slowdown that is not thermal. posture — a thermal hardware slowdown (cooling-limited), corrected-error counters, memory rows that were repaired. PCIe link width is not judged here: a narrower link than the card's maximum is by design in an x4 slot, so a regression against the device's own history is the hardware forecast. A transient flag must be confirmed by a newer collection before it alarms (health_rules.CONFIRM_BEFORE_ALARM), and a warn or posture here does not open a ticket by default. No adapter reported → agent status stands |
fans |
Measured fan speeds: per fan a burst of RPM samples, the commanded duty where the board exposes it, and the mode. Linux through hwmon; Windows only when LibreHardwareMonitor or OpenHardwareMonitor is running and exposes its WMI namespace | warn only. A stall — every sample 0 RPM while the board drives the fan at ≥ 30 % duty (a fan-stop mode commands ~0 % and is not a stall); instability — at least 4 running samples, a mean ≥ 300 RPM and a coefficient of variation above 15 % at a constant setting (possible bearing wear). Fans flagged idle_or_absent are skipped. Slow drift against the fan's own baseline needs months of data and is the hardware forecast. Needs a newer collection to confirm before it alarms. No fan to judge → agent status stands |
battery |
Battery health and charge (laptops) | health_percent < 50 → crit; < 70 → warn. Laptops only; battery.present drives the device (laptop/desktop) pie |
reliability |
Grouped Error/Critical event-log breakdown, stability index, boot instants | Scored on user-visible impact and on nothing else. The Windows Error/Critical log is mostly internal component failures Windows itself tolerates, so a pattern is a finding only once the classifier (ADR-0026) has established that someone would have noticed: user_impact ∈ none/degraded/crashed/data_at_risk (unknown when it cannot tell), plus a plain-language symptom. category/severity/cause are still stamped for the heatmap and the detail view; they decide nothing. Verdict: an active crashed or data_at_risk that recurred → crit; any other active impact — a single crashed or data_at_risk, or a degraded however long it persists — → warn; everything else → ok. One rule for every impact: critical means it is still happening, which a single occurrence cannot establish. The stability_index overlay still applies on top (< 3 → crit, < 6 → warn) and is named in the reason when it decides. Currency comes from the same evidence as before: active (seen within 48 h, or on ≥ 3 days whose last hit is under 72 h old), recurring (count ≥ 2 or ≥ 2 distinct days — a count is unambiguous once an impact is established), burst (one day holds ≥ 80 % and it has gone quiet). Kernel-Power/41, BugCheck/1001 and WER-SystemErrorReporting/1001 are floored at crashed whatever the classifier said or whether it ran at all, unless suppressed — the fallback that keeps this section working without an API key. Every group carries a classification_state (classified/pending/unavailable/unclassified) so a missing verdict is never read as a clean one, and the reason says which. The reason is written in symptoms and names no provider, event id or error code; per-pattern detail travels on details.patterns. A reliability incident must be confirmed by a newer collection before it alarms (health_rules.CONFIRM_BEFORE_ALARM), and a warn here does not open a ticket by default. See ADR-0065 |
hardware_errors |
Hardware events attributed to a component (processor, memory, PCIe, graphics, storage, power, platform) over a rolling window, from the Windows event log (WHEA, memory diagnostics, display and storage providers) or the Linux journal, plus edac memory counters and PCIe aer counters, and the crash-by-application summary used to spot instability |
Judged by component, severity class and activity, and reported as "risk rising, component X, symptom Y". It escalates only on uncorrected errors and precursors, so it never double-alarms with reliability: crash records (Kernel-Power 41, bugchecks) attribute and corroborate but never raise a finding alone. crit — an active, recurring uncorrected-error group (WHEA 18, a hardware Xid); an active failed memory test; uncorrected EDAC counts; PCIe uncorrected errors while such a group is active. warn — one active uncorrected-error group; repeated graphics-driver resets (on ≥ 3 distinct days) corroborated by a GPU bugcheck or a hardware Xid; active, recurring retries on internal disks (USB and SD retries are set aside); crashes across ≥ 4 unrelated programs with ≥ 5 memory-access or illegal-instruction faults while a processor or memory symptom is active (possible RAM or CPU instability); PCIe uncorrected errors alone. posture — active corrected-error groups, an uncorrected group not seen recently, graphics resets without corroboration. Reasons are symptoms, never event ids. Confirmed by a newer collection before it alarms, and a warn or posture does not open a ticket by default. Whether a corrected rate is rising is the hardware forecast |
web_activity |
Observed domains (parental controls) | a serious flagged hit (custom / seed / external_adult) in 24 h → crit; a bypass hit in 24 h → warn (see parental-controls.md) |
listening_ports |
Listening TCP/UDP ports | a non-loopback listener on 22 / 3389 / 5900 / 5985 / 5986 → posture (how the machine is set up, not an event; a port that appears is a change notification) |
local_accounts |
Accounts on the machine (local and Microsoft on Windows, /etc/passwd on Linux) plus the machine password policy — also the inventory for the account_* governance tools, and where each account publishes the verbs it cannot perform |
an enabled admin with password_required false and no password ever set → crit; built-in Administrator or Guest enabled → warn (Windows only — root being enabled on Linux is not a finding); an admin that also carries denied logon rights → warn (one of the two settings is stale) (see account-governance.md) |
logon_failures |
Failed sign-ins per account over 24 h, split by interactive / network / remote (Windows Security log; sshd + PAM failures from the journal on Linux, where network does not occur) |
≥ 15 failures against a single account or ≥ 15 against usernames that do not exist here → warn. Never crit — a failed sign-in is not by itself a compromised machine |
backup_status |
Restore points, File History, OneDrive | no restore point in 30 days and File History not running and OneDrive not running → warn |
net_quality |
Gateway + reference ping probe | reference loss ≥ 60 % → crit; gateway latency > 100 ms or loss > 20 % → warn |
installed_software |
Installed programs inventory | no rule — agent-reported |
browser_extensions |
Browser extensions across profiles | no rule — agent-reported |
scheduled_tasks |
Non-Microsoft scheduled tasks | no rule — agent-reported |
services |
Service inventory (Windows: all services; Linux: failed systemd units) | Windows: an auto-start service that is not running → posture (on a real PC these are updater and trigger-start services idling by design; a service that fails shows up as Service Control Manager events in reliability); Linux: a failed unit → warn; nothing reported → agent status stands |
autostart |
Autostart / run-key entries | no rule — agent-reported |
peripherals |
Connected devices | no rule — agent-reported |
printers |
Installed printers | always ok; the reason names printers in error/offline (a switched-off peripheral is not a finding about the machine) |
network |
Adapters and IP configuration | no rule — agent-reported |
routing |
Routing table | no rule — agent-reported |
wifi_quality |
Wi-Fi signal / link quality | no rule — agent-reported |
time_sync |
Clock synchronization state | offset_secs beyond ±5 s → warn; synchronized false → warn; no reading (synchronized/offset_secs null — time service idle or not queryable) → agent status stands, an unknown is not a finding |
uptime |
Boot time and uptime | Windows: ≥ 30 days → posture (updates apply on reboot); Linux: never a finding |
processes |
Running-process summary | no rule — agent-reported |
screen_time |
Whole-machine interactive minutes per day | no rule — informational (see below) |
What feeds Today
A few informational sections drive Today's KPIs and health donut
rather than a per-section status: reboot_pending, app_updates, win_update,
defender_quarantine, os_support, the disk-fill forecast and the hardware forecasts
all roll up into the KPI numbers, and every section's worst-of status rolls up into the
donut.
Incidents and posture
Every section verdict belongs to a tier, computed next to status in
health_rules.evaluate_section and carried as tier on the section: incident (warn
/ crit — time-bound, allowed to alarm), posture (a standing fact — listed and aged,
never alarmed on, never rolled up) or none. attention is true only for incidents. The
five sections that used to carry the agent's own grade (services, encryption,
printers, time_sync, uptime) now report without grading — the collectors always send
status: "ok" — and the rules above are the only judgement, so the server can relax a
section as well as tighten it. A non-ok section also carries since/age_seconds on
the read paths that have an alert-state store: how long it has held its current status,
as recorded by the alert loop (so ages exist only while KENNY_ALERT_INTERVAL_SECS > 0).
See ADR-0058.
Reliability categorization
The reliability section reports a breakdown of Error/Critical Windows event-log
entries — grouped by source + event_id, each with a sample message and per-day counts
— rather than a single number. The agent reports what happened and does not grade it: it
always sends status: "ok" for this section, and the health rule below is the only
judgement. A push whose event-log probe failed carries no counts at all (only a
reliability unavailable summary), so a failed reading is never mistaken for a clean one. To make those groups legible (and to score them
meaningfully, see below), the server sorts each distinct group into one friendly
category:
Disk & storage · App crash / hang · Bluescreen / bugcheck · Driver & hardware · Power & boot · Windows service · Windows Update · Network · Security · Other.
— plus a severity (benign / notable / serious, or unknown when the model is
genuinely unsure) and a short plain-language suspected cause for the pattern.
The classification is done by the connected LLM (Haiku), validated against fixed
enums, and persisted by (source, event_id) in the event_classifications table
(ADR-0058), mirrored in memory. A pattern is classified once, in the background, right
after the telemetry push that first carries it lands — ingestion never waits for the
model — and the persisted verdict is stamped onto every snapshot read from then on, on
the same read-path seam as alarm suppression below. So push alerting, the weekly digest,
the fleet list, MCP and the dashboard all score the same severity: one verdict per host.
Category/severity/suspected-cause are server-side annotations; the agent never sends them.
Without an Anthropic API key, with Reliability event classification or the AI master
switch off in Admin → AI, on an API error, or when the model's answer was cut off or
declined, a pattern stays unclassified and is
scored as severity="unknown" — never as benign — and the heatmaps, health scoring, and
expandable raw groups still work. A classifier model upgrade drops the old verdicts at
boot and re-classifies.
This drives both the per-host category × day heatmap on
the host page's Reliability section and the health rule
itself: a pattern's severity is what tells "300 repeats of one known-benign timeout"
apart from "300 distinct novel errors", and its activity — derived from the by_day
histogram and last_seen the agent already sends — is what tells a reboot storm a week
ago apart from a pattern firing every day (see the reliability row in the section table
above). A group with severity="serious" also flags its heatmap cell crit, even when
the agent-reported Windows level is plain "error".
See ADR-0026 for the categorization decision and ADR-0058 for why the verdicts are persisted and scoring follows activity.
Alarm suppression
A single, well-known-benign event pattern can dominate a host's reliability scoring — e.g.
the Microsoft-Windows-CAPI2 / 4176 "AuthSafes count" quirk some Windows builds log
hundreds of times a day from CryptSvc, with no known root cause or fix. The operator can
suppress a specific (source, event_id) pattern from the Reliability section detail:
either a click next to the offending event row (host-scoped, exact source), or the
suppression panel's manual form (event id required, source optional — an empty source
matches any source reporting that event id). The form defaults to this host and offers
widening the rule to the whole fleet.
A suppressed pattern:
- stays fully visible with its full raw count, in the raw event table and the category × day heatmap — suppression never hides volume;
- carries a distinct
suppressedbadge, never thebenignseverity pill — "the model classified this as harmless" and "the operator decided to ignore this" are different claims, from different sources, and the UI keeps them visually separate; - is excluded from scoring — it never counts as a finding, however active it is and
whatever impact it carries, and drops out of the health rule's reason string, replaced by
an
[N suppressed]note so the reader knows the quiet is explained, not guessed. It also overrides the crash-marker floor: explicit operator intent beats an automatic escalation, or a suppressedKernel-Power/41could never actually be muted; - does not affect the
stability_indexoverlay — the Windows Reliability Index is an independent, agent-computed signal a suppression rule carries no information about, so it keeps applying on top regardless of what's suppressed.
Adding or removing a rule re-evaluates the affected hosts immediately, so the alert state and any ticket the muted pattern had already opened are reconciled then and there rather than at the loop's next pass — muting a pattern takes back the work it created.
Suppression is a synchronous, LLM-free rule lookup stamped on the telemetry store's
read path — the same seam the persisted classification above rides — so every health
consumer sees it: push alerting, the weekly digest, the fleet list, and MCP's
agent_health/agent_snapshot all see the same suppressed marker. Rules are managed via /api/reliability/suppressions
(operator+ to write) or the reliability_suppression_list/_add/_remove MCP tools. See
ADR-0041.
Screen time
The screen_time section reports whole-machine interactive minutes per calendar day
over a 7-day window — for parental awareness of how much a PC was actually in use. It is
deliberately coarse: day buckets only, and nothing finer. There are no usernames, no
per-user split, no app names or titles, and no timestamps below the day bucket; the shape
of the payload cannot express them.
kenny reports, parents judge
No health rule judges screen time — a number of hours is neither warn nor crit. The
section always carries status: "ok" and surfaces as 7-day bars in the drill-down.
See ADR-0029, and the
parental-controls.md guide.
Retention & limits
- Retention: the server keeps roughly 30 days of per-agent snapshot history (latest + trend); older snapshots auto-prune.
-
Per-push caps: each snapshot is bounded so a misbehaving collector cannot flood the store:
Variable Default Meaning KENNY_MAX_TELEMETRY_BYTES262144(256 KiB)maximum encoded size of one push KENNY_MAX_TELEMETRY_SECTIONS128maximum number of sections per push
See setup.md for these and other environment variables, and
protocol.md for the on-the-wire telemetry frame and section shapes.
See also
user-guide.md— reading the fleet view and drill-downdashboard.md— the dashboard panels in detailprotocol.md— the agent ⇄ server wire contract- ADR-0007 — push model & SQLite storage
- ADR-0026 — LLM reliability categorization
- ADR-0028 — security & resilience sections
- ADR-0029 — screen-time aggregation